Economic Policy Review Executive Summary
Measuring Treasury Market Liquidity
| Recapping an article from the September 2003 issue |
|
||
| of the Economic Policy Review, Volume 9, Number 3 | View full article |
||
|
|
26 pages / 327 kb | ||
|
Author: Michael J. Fleming |
Disclaimer | ||
| Index of executive summaries |
|
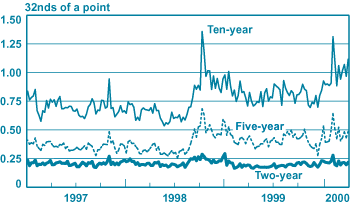
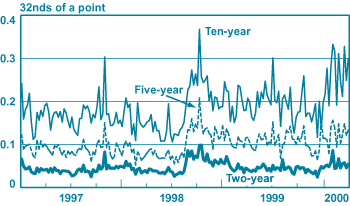
Overview Fleming analyzes a comprehensive set of liquidity measures for the U.S. Treasury market. He concludes that the bid-ask spread is a superior tool for assessing and tracking the liquidity of Treasury securities. A second measure, the price impact coefficient, is also found to be effective, but it lacks the spread’s ease of use and availability in real time. Background The vast liquidity of Treasuries makes the securities important for a range of market-related trading and analytical activities. For example, because market participants can buy and sell the issues quickly and with low transaction costs, they use Treasuries to hedge positions in other fixed-income securities and to speculate on interest rates. The high volume of trading and narrow bid-ask spreads also make Treasury rates reliable reference rates for pricing and analyzing other securities. Despite the importance of Treasury market liquidity, in-depth studies on the topic have been hampered by the absence of high-frequency, or highly detailed, market data. Recently, however, these data have become available from major brokers in the interdealer market, enabling researchers to assess and track liquidity more accurately. Discussion In a liquid market, trades can be executed at no cost. In practice, a market with very low transaction costs is characterized as liquid while one with high costs is illiquid. It is difficult to measure these costs, though, because they depend on factors such as the size of a trade, its timing, the trading venue, and the counterparties. Furthermore, the information needed to calculate transaction costs is often unavailable. As a result, a wide range of measures are used to evaluate liquidity. However, the measures are not equally effective, and each has its advantages and disadvantages. Trading volume is an indirect but widely cited measure. Its popularity may stem from its simplicity and availability, as well as the fact that more active markets tend to be more liquid. Still, studies have linked trading volume to volatility, which can impede market liquidity. Trading frequency reflects the number of trades executed within a specified interval, without regard to trade size. High trading frequency may also indicate a more liquid market, but it too can be associated with volatility and hence lower liquidity. The bid-ask spread is a commonly used indicator of liquidity. It measures the cost of executing a small trade, with the cost usually calculated as the difference between the bid or offer price and the bid-ask midpoint. The measure can thus be calculated quickly and easily with data widely available in real time. Yet because bid and offer quotes are good only for limited quantities and time periods, the spread just measures the cost of executing a single trade of a certain size. Quote size is an estimate of the quantity of securities tradable at the bid and offer prices. It helps account for market depth and complements the bid-ask spread. Market makers, however, often do not reveal the full quantities they will transact at a given price, so the measured depth underestimates the true depth. An alternative gauge of depth is trade size, which measures the quantity of securities tradable at the bid and offer prices, reflecting any negotiation over quantity. However, trade size also underestimates market depth, because the quantity traded is often less than the quantity that could have been traded at a given price. Another popular measure of liquidity—the price impact coefficient—considers the rise (fall) in price that typically occurs with a buyer-initiated (seller-initiated) trade. The measure is useful to those executing large trades or a series of trades, and together with the bid-ask spread and the aforementioned depth measures provides a fairly complete picture of liquidity. A drawback of the price impact coefficient, however, is the difficulty of obtaining the data required for estimation, particularly on a real-time basis. The final measure examined by the author is the spread between more and less liquid securities, often computed as the difference in yields of an on-the-run and an off-the-run security with similar cash flow characteristics. On the one hand, this on-the-run/off-the-run yield spread can be calculated without high-frequency data, and it provides insight into the value of liquidity not provided by the other measures. On the other hand, the spread can be difficult to interpret, and factors besides liquidity can cause on-the-run securities to trade at a premium, confounding interpretation of the spread. Using high-frequency interdealer data, Fleming estimates and evaluates these seven variables to determine their effectiveness in measuring liquidity. He analyzes them relative to one another, across securities, and over time. And while he observes that there is no single gauge of liquidity against which the measures can be definitively judged, he offers three guidelines for assessing them. First, a measure that directly quantifies the cost of transacting is likely to be superior. Second, a measure should behave in a manner consistent with market participants' views on liquidity. Finally, a measure should be easy to calculate and understand as well as available to market participants on a real-time basis. Findings Fleming finds that according to his first two criteria, the bid-ask spread and the price impact coefficient are sound liquidity measures. Both directly quantify the costs of transacting, with the bid-ask spread measuring the cost of executing a single trade of limited size and the price impact coefficient measuring the price effects of a trade. Both also correlate with episodes of reported poor market liquidity in the expected manner, rising sharply with the equity market declines in October 1997, the financial market turmoil in the fall of 1998, and the market disruptions occurring around the Treasury's quarterly refunding announcement in February 2000 (charts). However, according to the third criterion, the bid-ask spread outperforms the price impact coefficient. The spread is simple to calculate and understand and is available in real time. In contrast, the price impact coefficient requires significant data and regression analysis to estimate, and timely estimation can be hindered by data limitations. Fleming finds that among the other measures, quote size, trade size, and the on-the-run/off-the-run yield spread are only modest proxies for market liquidity. These variables correlate less strongly with the episodes of reported poor liquidity and with the bid-ask spread and price impact coefficient. Trading volume and trading frequency are in fact weak proxies for liquidity, since both high and low levels of trading activity are associated with periods of poor liquidity. |
|
|
| Bid-Ask Spreads of U.S. Treasury Notes |
 |
| Source: Author’s calculations, based on data from GovPX. |
| Note: The chart plots mean interdealer bid-ask spreads by week for the on-the-run notes. |
| Price Impact of U.S. Treasury Note Trades |
 |
| Source: Author’s calculations, based on data from GovPX. |
| Notes: The chart plots the price impact of interdealer trades by week for the on-the-run notes. The price impact is measured as the slope coefficient from a regression of five-minute price changes on the net number of trades over the same interval. The net number of trades equals the number of buyer-initiated less seller-initiated trades. |
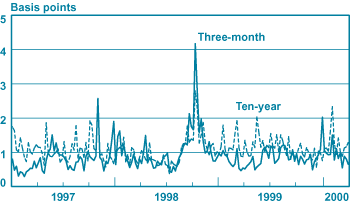
| Three-Month Bill and Ten-Year Note Yield Volatility |
 |
| Source: Author’s calculations, based on data from GovPX. |
| Note: The chart plots standard deviations of thirty-minute yield changes by week for the indicated on-the-run securities. |
| Disclaimer |
|
The views expressed in this article are those of the author and do not necessarily reflect the position of the Federal Reserve Bank of New York or the Federal Reserve System. |
By continuing to use our site, you agree to our Terms of Use and Privacy Statement. You can learn more about how we use cookies by reviewing our Privacy Statement. 


