This new series, produced by the Research Group's Publications Function, focuses on the academic and public policy issues shaping our research.

In a series on Liberty Street Economics, our bloggers considered factors that might be driving a change in the nature of liquidity in key financial markets since the financial crisis.

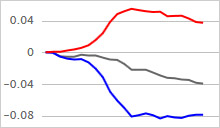
In recent work, economists described the New York Fed’s dynamic stochastic equilibrium model, assessed its forecasting accuracy, and shared source code used for model estimation.

Students in recent years have been paying more to attend college and earning less upon graduation—trends that have raised questions about whether a college education remains a good investment. But research from economists Jaison Abel and Richard Deitz finds that the benefits of college still tend to outweigh the costs.

This New York Fed-hosted microsite describes an initiative of central bank researchers who are engaged in a coordinated study of global banks and their activities internationally.

Interactive maps and charts shed light on the unprecedented growth, market share, student loans, tuition pricing, federal grants, and more for for-profit higher education institutions.
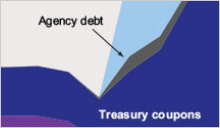
The New York Fed’s Research and Markets Groups recently teamed up on a five-part blog series covering the history and evolution of the Federal Reserve’s System Open Market Account (SOMA), a portfolio used to support implementation of monetary policy. The series, posted on Liberty Street Economics, was conceived to promote a better understanding of how the portfolio generates income, why income has increased in recent years, and why future net income from the portfolio will depend on a wide range of factors and may be more variable for a period of time.

A series of interactive maps tracks school funding and expenditures in New York and New Jersey, revealing a wide variability in finances across districts and over time.
Our economists tap the geographical information available in the FRBNY Consumer Credit Panel data set to map regional variation in several dimensions of student debt. Indebtedness is significant for student loan borrowers in virtually all U.S. states, with balances per borrower ranging from just under $21,000 in Wyoming to over $40,000 in Washington, D.C. The maps also show distinct differences in delinquency by state; West Virginia has the highest share of balances ninety-plus days delinquent, at nearly 18 percent, and South Dakota has the lowest rate, at just over 6.5 percent.

Since the 1980s, employment had become increasingly concentrated in higher- and lower-skilled jobs—a phenomenon called job polarization. While the trend is an important one in the labor market, our research hasn’t found it to be a key contributor to the sluggish jobs recovery. Analysis, such as in a recent post on our Liberty Street Economics blog, suggests that weakness is broad-based and not limited to any market segment. Interactive charts prepared in connection with the blog post allow for comparison of unemployment rates, average durations of unemployment, and job-finding rates for workers in a range of “routine” and “nonroutine” occupations.
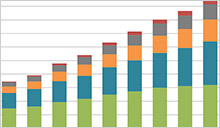
Higher education is an important investment for young workers seeking better jobs and greater income, but it is accompanied by a growing student debt burden. Total student loan balances tripled to nearly $1 trillion between 2004 and 2012. Using data from the New York Fed’s Quarterly Report on Household Debt and Credit, our economists present new analysis on the historical and current student debt picture and consider its implications for borrowers and the economy.
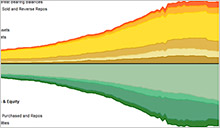
Economists in the Financial Intermediation Function have published the first edition of a new quarterly report tracking the consolidated financial condition of the U.S. commercial banking industry. Quarterly Trends for Consolidated U.S. Banking Organizations analyzes aggregate trends in profitability, assets, capital, and other key measures for commercial banks and bank holding companies (BHCs). The report accounts for nonbank subsidiaries of BHCs, such as broker-dealers and asset management firms, distinguishing it from other industry profiles.

One vital sign of housing market conditions is the change in home prices. The Federal Reserve Bank of New York currently releases a set of interactive maps and charts each month to provide a look at current conditions. Based on data from CoreLogic, the maps show the percent change in price from a year earlier for nearly 1,200 countries, and includes a video sequence of these changes since 2003.

In light of the fiscal pressures that have been developing in Puerto Rico, a team made up of staff from the New York Fed's Research, Outreach, International, and Markets groups was commissioned to update the New York Fed’s 2012 report on the Commonwealth, with a special focus on improving Puerto Rico’s fiscal outcomes.

This new research hub centralizes the wide-ranging microeconomic data, research, and analysis produced by the New York Fed.

New York Fed researchers recently published an in-depth study of the behavior and economics of large and complex banks. In an effort to inform public debate on the “too-big-to-fail” question, the authors look broadly at the costs and benefits of bank size, the sources and measurement of bank complexity, and strategies for preventing disorderly failures. Check out the posts in a Liberty Street Economics blog series, which link through to the more detailed Economic Policy Review papers.
The Research and Statistics Group recently published the results of a broad investigation into the transformation of banks and financial intermediation over the last several decades. In a special issue of the Economic Policy Review and a seven-part companion series on the Liberty Street Economics blog, our economists look at the causes and consequences of the industry-changing shift in the way banks operate—from a deposit-funded, hold-to-maturity lending model to the more complex credit intermediation chain associated with securitization.
New York Fed economists are among those seeking to understand the steep rise and decline in housing prices at the root of the 2007-09 financial crisis. A recent study in our Staff Reports series investigates the role of speculative buyers, arguing that they were present in the housing market in larger numbers than previously understood and behaving in ways that exacerbated both the boom and bust in home values.
For a recent Liberty Street Economics blog series, a dozen of our economists teamed up to frame the issues affecting the U.S. jobs picture. This interactive graphic, developed for the project, tracks three key measures of labor market health—the unemployment rate, the labor market participation rate, and the employment-to-population ratio—over five recent recessions. The chart also links to blog posts that assess the importance of changing long-term trends in participation and cyclical behaviors.